TRVReportSignalStrengthVisualizer visualizes numeric values by a drawing a "signal strength" diagrams.
Unit RVReportValueVisualizer;
Syntax
TRVReportSignalStrengthVisualizer = class (TRVReportCustomValueVisualizer)
TObject TPersistent TCollectionItem |
Description
This visualizer displays a "signal strength" diagram for each value. This diagram consists of shapes of increased heights (so this diagram is inscribed in an imaginary right triangle).
This visualizer supports two types of shapes: bars and wedges, specified in DisplayStyle property. For simplicity, we will call them "bars".
The count of bars is specified in PartsCount, a distance between them is specified in Spacing.
Values are visualized by filling bars. The count of full bars is proportional to the visualized value. Displaying all empty bars corresponds to MinValue, displaying all full bars corresponds to MaxValue. Values less than MinValue are displayed as MinValue, values greater than MaxValue are displayed as MaxValue.
Full bars are drawn using Color and LineColor, empty bars are drawn using ColorEmpty and LineColorEmpty. Empty bars can be semitransparent.
The following properties affect bar drawing: Gradient and LineUsesFillColor.
Examples
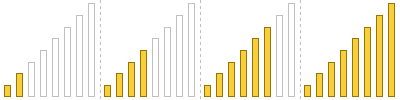
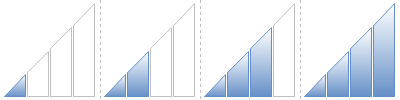
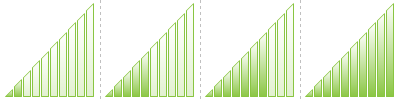
The examples use the following data:
20 |
46.7 |
73.3 |
100 |
Example 1: default values
Example 2:
Color = ColorEmpty = $41C589, OpacityEmpty = 25000, PartsCount = 10
Example 3:
Color = $39CFF8, PartsCount = 8, Spacing = 5, Gradient = False, DisplayStyle = rvrsssBars