TRVReportShapeRepeaterVisualizer visualizes numeric values by displaying the count of shapes proportional to these values.
Unit RVReportValueVisualizer;
Syntax
TRVReportShapeRepeaterVisualizer = class (TRVReportCustomShapeVisualizer)
TObject TPersistent TCollectionItem TRVReportCustomValueVisualizerBase |
Description
Values are visualized by filling shapes. The count of full shapes is proportional to the visualized value. Displaying all empty shapes corresponds to MinValue, displaying all full shapes corresponds to MaxValue. Values less than MinValue are displayed as MinValue, values greater than MaxValue are displayed as MaxValue.
Shapes are shown in RowCount rows and ColCount columns, the filling direction is specified in Direction.
The shape is defined in ShapeProperties.
Full shapes are drawn using Color and LineColor, empty shapes are drawn using ColorEmpty and LineColorEmpty. Empty shapes can be semitransparent
The following properties affect shape drawing: Gradient and LineUsesFillColor.
Optionally, background can be filled using BackgroundColor.
Distance between shapes is specified in Spacing, space around the whole diagram is specified in Padding and Margin.
Shape size may be limited by MaxShapeSize.
By default, shapes are inscribed in squares. You can stretch them by changing ShapeScaleX.
Examples
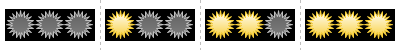
Example 1: ColCount = 4; ShapeProperties: Shape = rvrshStar, PointCount = 5, MiddlePercent 40; Gradient = False

Example 2: ColCount = 3; ShapeProperties: Shape = rvrshStar, PointCount = 20, MiddlePercent 60; BackgroundColor = clBlack, Padding = 2
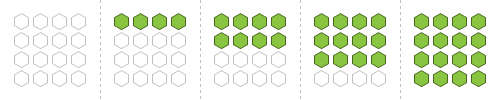
Example 3: ColCount = RowCount = 4; ShapeProperties: Shape = rvrshPolygon, PointCount = 6, Spacing = 2, Gradient = False, ColorEmpty = clNone, LineColorEmpty = clSilver, Color = $41C589: