This property specifies whether values are displayed using all colors or a single color.
property SingleColorMode: Boolean;
The range of values from MinValue to MaxValue are separated into three areas: "green", "yellow", "red".
A gauge is filled from the left side to the position corresponding to a value.
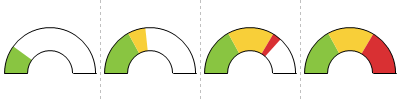
If SingleColorMode = False, this fill uses all area colors.
If RedLowValues = True, this fill uses a single color corresponding to the value's area.
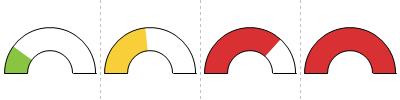
The examples use the following data:
20 |
46.7 |
73.3 |
100 |
It's supposed that "green" area contains good values, "red" value contains bad values, "yellow" area contains neutral values.
Default value
False
See also
•RedAreaPercent, YellowAreaPercent